MBA Mondays From The Archives: The Balance Sheet
Continuing the visit back in time to the MBA Mondays Archives, today we are going to rerun the post on the Balance Sheet, which is a financial snapshot into the health of your business.
——————————————————-
Today on MBA Mondays we are going to talk about the Balance Sheet.
The Balance Sheet shows how much capital you have built up in your business.
If you go back to my post on Accounting, you will recall that there are two kinds of accounts in a company's chart of accounts; revenue and expense accounts and asset and liability accounts.
Last week we talked about the Profit and Loss statement which is a report of the revenue and expense accounts.
The Balance Sheet is a report of the asset and liability accounts. Assets are things you own in your business, like cash, capital equipment, and money that is owed to you for products and services you have delivered to customers. Liabilities are obligations of the business, like bills you have yet to pay, money you have borrowed from a bank or investors.
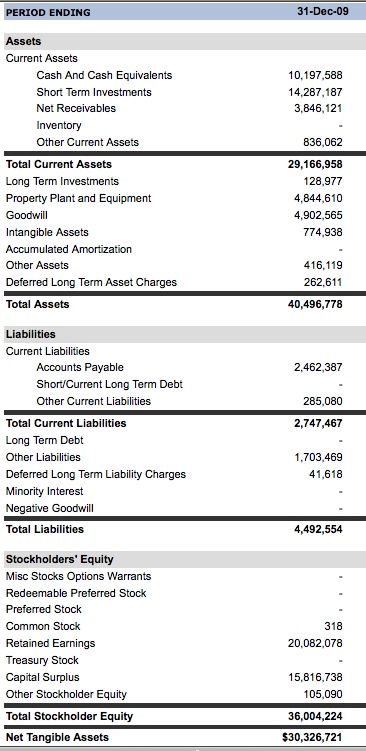
Here is Google's balance sheet as of 12/31/2009:
Let's start from the top and work our way down.
The top line, cash, is the single most important item on the balance sheet. Cash is the fuel of a business. If you run out of cash, you are in big trouble unless there is a "filling station" nearby that is willing to fund your business. Alan Shugart, founder of Seagate and a few other disk drive companies, famously said "cash is more important than your mother." That's how important cash is and you never want to get into a situation where you run out of it.
The second line, short term investments, is basically additional cash. Most startups won't have this line item on their balance sheet. But when you are Google and are sitting on $24bn of cash and short term investments, it makes sense to invest some of your cash in "short term instruments". Hopefully for Google and its shareholders, these investments are safe, liquid, and are at very minimal risk of loss.
The next line is "accounts receivable". Google calls it "net receivables' because they are netting out money some of their partners owe them. I don't really know why they are doing it that way. But for most companies, this line item is called Accounts Receivable and it is the total amount of money owed to the business for products and services that have been delivered but have not been collected. It's the money your customers owe your business. If this number gets really big relative to revenues (for example if it represents more than three months of revenues) then you know something is wrong with the business. We'll talk more about that in an upcoming post about financial statement analysis.
I'm only going to cover the big line items in this balance sheet. So the next line item to look at is called Total Current Assets. That's the amount of assets that you can turn into cash fairly quickly. It is often considered a measure of the "liquidity of the business."
The next set of assets are "long term assets" that cannot be turned into cash easily. I'll mention three of them. Long Term Investments are probably Google's minority investments in venture stage companies and other such things. The most important long term asset is "Property Plant and Equipment" which is the cost of your capital equipment. For the companies we typically invest in, this number is not large unless they rack their own servers. Google of course does just that and has spent $4.8bn to date (net of depreciation) on its "factory". Depreciation is the annual cost of writing down the value of your property plant and equipment. It appears as a line in the profit and loss statement. The final long term asset I'll mention is Goodwill. This is a hard one to explain. But I'll try. When you purchase a business, like YouTube, for more than it's "book value" you must record the difference as Goodwill. Google has paid up for a bunch of businesses, like YouTube and Doubleclick, and it's Goodwill is a large number, currently $4.9bn. If you think that the value of any of the businesses you have acquired has gone down, you can write off some or all of that Goodwill. That will create a large one time expense on your profit and loss statement.
After cash, I believe the liability section of the balance sheet is the most important section. It shows the businesses' debts. And the other thing that can put you out of business aside from running out of cash is inability to pay your debts. That is called bankruptcy. Of course, running out of cash is one reason you may not be able to pay your debts. But many companies go bankrupt with huge amounts of cash on their books. So it is critical to understand a company's debts.
The main current liabilities are accounts payable and accrued expenses. Since we don't see any accrued expenses on Google's balance sheet I assume they are lumping the two together under accounts payable. They are closely related. Both represent expenses of the business that have yet to be paid. The difference is that accounts payable are for bills the company receives from other businesses. And accrued expenses are accounting entries a company makes in anticipation of being billed. A good example of an accounts payable is a legal bill you have not paid. A good example of an accrued expense is employee benefits that you have not yet been billed for that you accrue for each month.
If you compare Current Liabilities to Current Assets, you'll get a sense of how tight a company is operating. Google's current assets are $29bn and its current liabilities are $2.7bn. It's good to be Google, they are not sweating it. Many of our portfolio companies operate with these numbers close to equal. They are sweating it.
Non current liabilities are mostly long term debt of the business. The amount of debt is interesting for sure. If it is very large compared to the total assets of the business its a reason to be concerned. But its even more important to dig into the term of the long term debt and find out when it is coming due and other important factors. You won't find that on the balance sheet. You'll need to get the footnotes of the financial statements to do that. Again, we'll talk more about that in a future post on financial statement analysis.
The next section of the balance sheet is called Stockholders Equity. This includes two categories of "equity". The first is the amount that equity investors, from VCs to public shareholders, have invested in the business. The second is the amount of earnings that have been retained in the business over the years. I'm not entirely sure how Google breaks out the two on it's balance sheet so we'll just talk about the total for now. Google's total stockholders equity is $36bn. That is also called the "book value" of the business.
The cool thing about a balance sheet is it has to balance out. Total Assets must equal Total Liabilities plus Stockholders Equity. In Google's case, total assets are $40.5bn. Total Liabilities are $4.5bn. If you subtract the liabilities from the assets, you get $36bn, which is the amount of stockholders equity.
We'll talk about cash flow statements next week and the fact that a balance sheet has to balance can be very helpful in analyzing and projecting out the cash flow of a business.
In summary, the Balance Sheet shows the value of all the capital that a business has built up over the years. The most important numbers in it are cash and liabilities. Always pay attention to those numbers. I almost never look at a profit and loss statement without also looking at a balance sheet. They really should be considered together as they are two sides of the same coin.