Posts from Google Analytics

Retention on AVC

There was an interesting conversation in the comments to my Retention post that I thought I'd highlight.

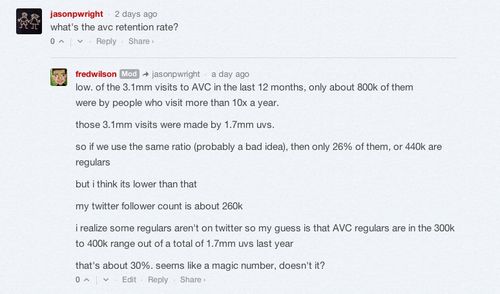
Avc retention

I can't figure out how to look at frequency and recency data in google analytics by UV as opposed to total visits. So this analysis is probably flawed. If anyone knows how to do that, please let me know in the comments.

But assuming the analysis is not totally flawed, the loyal readership of AVC is between 200k and 400k out of a total of 1.7mm unique visitors last year.

That means only 10% to 25% of the total visitors are regulars. That's not particularly great retention from what I can tell. But I sure do appreciate all of you loyal readers.

#Weblogs

Guest Post From Shana Carp: Communities Make Business Sense

Sometime over the summer, there was a discussion of analytics in the AVC comments and Shana said something like "I would love to do a serious data analysis on AVC's analytics." So I reached out to Shana and told her that I would give her access to my Google Analytics and Disqus Analytics accounts and she could go crazy on the numbers. But I told her that she had to produce a post out of all of that work. She agreed and this guest post is the result of those efforts.

——————————————————————————————-

One of the things I find really hard to wrap my head around about AVC.com is that for all intents and purposes it runs like any other media site.  To me, this is my bar where I hang out, but in reality, this site functions much like many other media sites such as the Atlantic, or Refinery29.  There is content, there are analytics, and there are ways of pushing out content, there are some ads and tools to push them out, there are some tools to make the community more social, but not much else.  If AVC.com had a business model (which it doesn’t, the advertising money goes to charity), it would be one similar to many content sites out there: Increase Users; Increase pageviews; Sell ads.  What makes this site unusual is that there is a large community of users, primarily driven by technology built by the team at Disqus.

It also leads to some interesting questions about this site in comparison to other media sites.  Most content sites are still trying to figure out the role of comments.  Do they ignore them?  Do they not have them?  Do they feature some content? Do they write about the comments?  Do they reward commenting behavior?  Does having a community make a difference to the business model of content sites?

On this site, it does.  Not only does it make a difference, comments here are highly correlated with unique pageviews of repeat users, uniques in general (not just for repeat users), time on site by repeat users, and time on site by everyone.

One half of unique pageviews over the past 9 months have been generated by repeat users.   
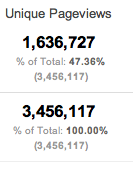
Chart1

I wanted to see if unique pageviews of returning users was correlated with the number of comments. I used a correlation coefficient (Spearman’s Rank Correlation Coefficient) which is a measure of correlation variables that behave monotonically, or in other words, the variables move up and down together. The correlation coefficient for unique pageviews generated by repeat visitors is 0.7973 to comments. This is a high correlation coefficient and suggests the two are linked.
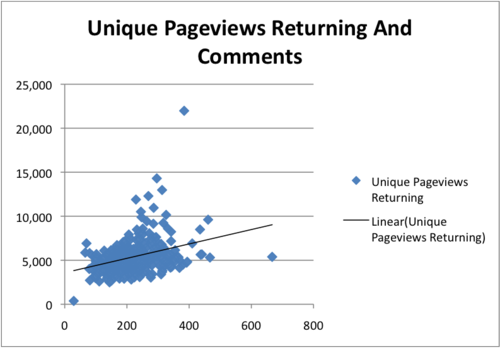
Chart2

To give a comparison point to explain this correlation coefficient, SEOMOZ reports for Good SEO Experiments a correlation coefficient(a linear measure of correlation) of 0.3 is considered quite good, even though 0.3 usually implies fairly low correlation.  Having a community on your site is therefore way more likely to be a factor that would generate significant traffic than SEO efforts, if we compare statistical significance.

I also looked at the rate of change for the percent of returning users versus the percent of new users. They line up quite nicely. They have a correlation coefficient of .9387.  However, the rate of change for new users as well as repeat users is quite small.  Granted, this is a niche audience, so I’m not totally surprised.  Still, it is nice to know that total user activity is very much driven by regular user activity.
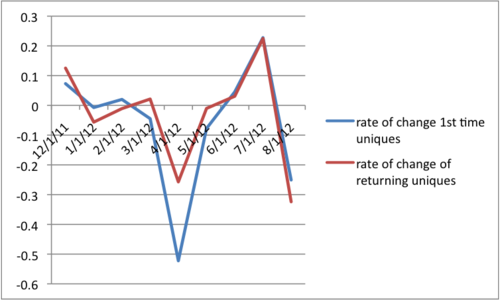
Chart3

However, average time on site for all users to comments is less correlative (though still significantly so), with a correlation coefficient of 0.6733.   Similarly, there is correlation coefficient of 0.6848 for average time on site for returning users versus comments.  I suspect the reason is that some people like emailing back replies, some people like to go the site to write replies, and some people like using Engagio to write replies.  Unfortunately there is no way to directly measure which people on this site are using email, Engagio, or the site itself to reply to comments.

The  correlation of all unique visitors is also highly correlative to comments.  (correlation coefficient =0.8413). 
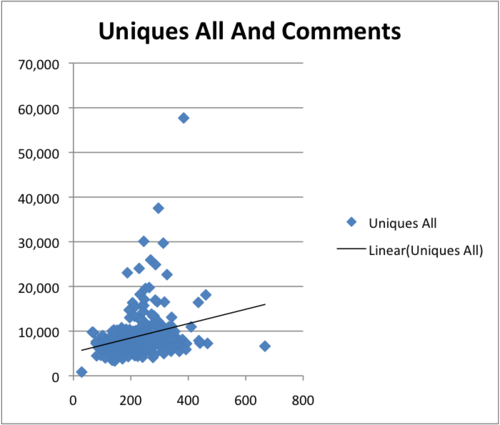
Chart5

This data leads me to believe that people are in fact coming to the site not just for the posts, but for the community surrounding the posts.  People are more curious about the chatter and the interactions that come out of the posts than the post itself.  Building out community means over time you will build out a growing site.

If you are a web publisher/media company and you are looking at this post, having a strong commenting platform (like Disqus) is going to be essential to your long-term success as a media outlet.  Communities can be bigger drivers of traffic than Search Engine Optimization.  Having a strong moderation/community management team in place is more essential than having SEO staff in the long term, since there is a higher correlation to factors that matter to growth and ad sales (pageviews, uniques, time one site) to having community.  The reason is that people are not just on your media sites to read: They are there to interact with other readers about what they have read.  Teaching your writers and your community to stick to your site to discuss articles in depth ends up causing long-term growth.

(some notes:)

1)My friend Daniel Choi, a PHD Candidate in Molecular Biology/Computational Biology at Princeton, helped me understand rho based correlations. Thank you Daniel.  

2)For the sake of discussion, Disqus and Google Analytics are two different reporting tools.  GA also samples when you are looking at daily data for 9 months for a site of this size.  Please therefore take this post with a grain of statistical salt.

3) William Mougayar was kind of enough to give me some data about Fred to see if Fred’s presence in the comments matters.  It didn’t make it into the post for a variety of reasons.  Thank you William, anyway.

4) Thank you Fred for cleaning up some of the language about correlations during the editing process

5)IRL I’m a web analyst who is job hunting for my next gig while handling some side projects.  If you like this post, feel free to get in touch)

#Web/Tech#Weblogs

Social Sources

Google Analytics has a relatively new feature that allows you to look at your "social sources" of traffic. According to Google, about 27% of the vists to AVC in the past month came from social sources. For those who are curious about the rest of the traffic, 30% is direct, 15% is search (much of which is really direct traffic), and of the rest, about half is from social sources.

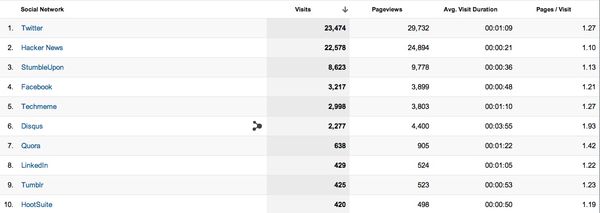
Here are the top social networks that drive traffic to AVC:

Social sources

Twitter and Hacker News have been the mainstays of the social traffic to AVC for a long time. Last year, StumbleUpon was driving a ton of traffic to AVC, but that waned early this year and it is much less of a factor today.

Facebook, Techmeme, and Disqus are the other big social drivers of traffic. 

And the traffic that Disqus drives is markedly different than all of the other social sources. These folks hang around longer, read more pages, and engage more.

If you have a blog or some other form of online media and have a Google Analytics tag on your pages, I suggest you take a look at your social sources. I think you'll find it interesting.

#Weblogs

Top Ten Sources

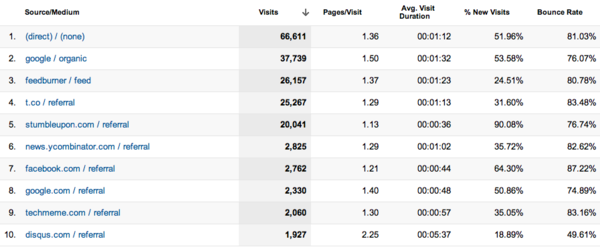
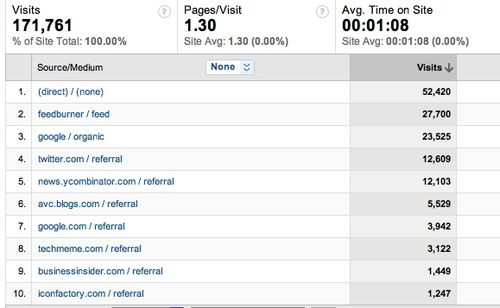
I took at look at Google Analytics this morning and was a bit surprised to see the makeup of the top ten sources of traffic to AVC in the past month.

Avc sources may 2012

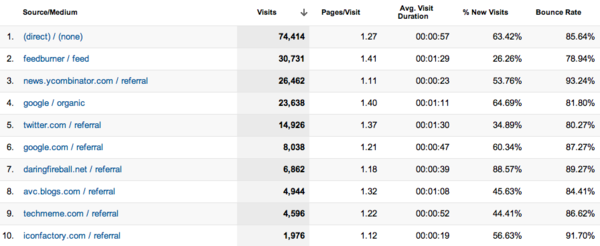
If we compare this to May 2010, when AVC got almost exactly the same amount of visitors, you can see that the makeup of traffic has changed a fair bit.

Avc sources may 2010

Search, Twitter, Stumbleupon, Facebook, and Disqus have all risen a fair bit as sources. Direct, Feedburner, Hacker News, and various specific sites have waned as sources of traffic.

Mobile visits have also doubled in the past two years from 11% to 22%. Frankly I thought they would be even higher by now.

What this tells me is platforms are ascendent as drivers of audience, particularly platforms like Twitter that are optimized for mobile.

It is also nice to see Disqus cracking the top ten. And the characteristics of the Disqus traffic is very different from the traffic that comes from the other top ten sources. The Disqus audience stays longer and is way more engaged. That makes sense. I hope to see Disqus rise in the top ten as they do more to drive traffic around their network.

It makes me think that Disqus could use a mobile reading app that shows Disqus users the interesting conversations happening in their network in real time. I would certainly be a big user of that.

But no matter how you slice it, we are in the era of mobile platforms. That is pretty clear to me this morning.

#Web/Tech#Weblogs

The Logged Out User (continued)

I brought this subject up a while back. It's a big one that doesn't get enough attention.

And yesterday we got some stats from Twitter that I'd like to talk about. Dick Costolo gave a "state of Twitter" press conference yesterday at Twitter HQ. Danny Sullivan was there and live blogged it. Here's the part of Danny's live blog that I'd like to focus on:

100 million active users.

over 400 million monthly uniques just to Twitter.com, according to Google Analytics

An active user is a Twitter user that logs into the service. So that means that 75% of Twitter's users don't log in every month.

The press in the audience asked the right question, "why do people behave that way?" and Dick used my mom in his reply:

Fred Wilson’s mom … checks Fred’s twitter stream.

We also got some stats on what the logged in users do.

40% of our active users now don’t tweet, way up from beginning of year. “We’re excited about that. I think that’s super healthy"

And the press asked the same question "why do people behave that way? and again Dick used my family in his reply:

His (fred's) son uses Twitter each day on iPhone and just follows NBA players. “For him, that’s Twitter.” Just reading what people say.

There's a reason why Dick used my mom and my son in his examples. I've been bending his ear about this behavior for years. I see so many people around me who either don't have a Twitter account and just read profiles and search results like they read blogs or people who have accounts and just follow certain people, create lists, and who login to Twitter to use it like an RSS reader.

Let's remember one of the cardinal rules of social media. Out of 100 people, 1% will create the content, 10% will curate the content, and the other 90% will simply consume it. That plays out on this blog, that plays out in Twitter, and that plays out in most of the services we are invested in.

Twitter has 400mm active users a month, 100mm of them are engaged enough to log in, but only 60mm tweet. For years people have made it out like this is a bad thing. It's not a bad thing. It is an amazing thing. Let people use the service the way they want and you'll get more users. Logged out users are users just like logged in users. We should focus more on them, build services for them, and treat them like users, not second class citizens.

#Web/Tech

Mobile Reading Trends At AVC

I noticed that 16.2% of the visits to AVC in the past 30 days were from mobile devices so I did a little digging into that number. I opened a spreadsheet and went back in time on google analytics and the result is this chart. If you want to make it larger, click on the chart and load it in its own tab.

Mobile visits to avc

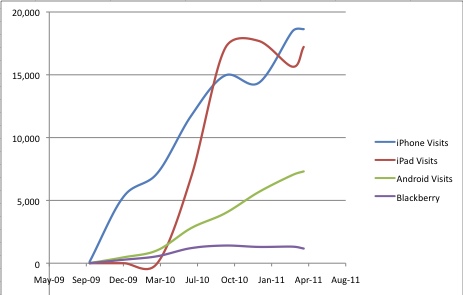
I then drew up a couple graphs. Here is total visits from the four most popular devices over time:

Mobile visits trend

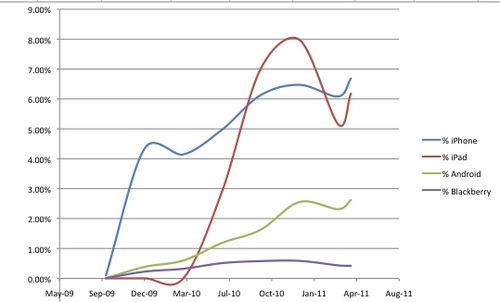
But traffic to AVC has been growing pretty rapidly, so then I looked at this chart expressed as a percent of total visits:

Mobile visits percentage

So what does all of this tell me? Well first, a lot of people are reading AVC on mobile devices. Total mobile visits to AVC in the past 30 days was just north of 45,000. But the mix is equally interesting.

Probably the most interesting figure is iPad vists per month. In September 2010, AVC had 17,091 visits from iPads. In the past 30 days, iPad visits were 17,219, essentially flat. And on a percentage of total visit basis, the number was 7% of all visits last September and it is 6% of total visits in the last 30 days. That is not what I would have expected. iPad visits to AVC are not growing and are declining on a percent of total traffic basis.

iPhone, on the other hand, continues to grow month after month and now represents 6.7% of all visits. However, it was 5% of all visits in June of 2010 and 6% of all visits in September of 2010. So iPhone visit growth is slowing after a tear in the second half of 2009 and the first half of 2010.

Android is coming up fast. It grew 4x as a percent of visits from March 2010 to March 2011. But Android is not growing fast enough to overtake iPhone and iPad anytime soon. At the current growth rates, that would not happen until late 2012 at the earliest and that assumes continued flattening of iPhone and iPad.

Blackberry trails the other three devices by a lot and Blackberry visits to AVC have not grown in absolute numbers since the middle of last year.

The AVC audience are early adopters and the leading edge of technology users. So these numbers are not likely to be representative of blogs or online media broadly. But it is still very interesting to see them.

The iPad numbers in particular are interesting. I'm wondering if iPad users are reading via applications that Google Analytics does not record as an iPad. That would make sense. If so, the iPad numbers could be significantly higher than the numbers shown above.

But the big message is the early adopters are reading more and more on their mobile devices and at the current growth rates, half of the visits to AVC could be on mobile devices by the end of 2012. That is a megatrend. And it is investable.


#mobile#Web/Tech

RSS: Not Dead Yet

I immediately thought of that great Monty Python skit when I read a series of posts in the past week declaring RSS "dead." If you look at the number of refers/visits coming from RSS, you might conclude that services like Facebook and Twitter are taking over the role of content syndication from RSS. That's essentially what MG Siegler concludes by looking at TechCrunch data in this post.

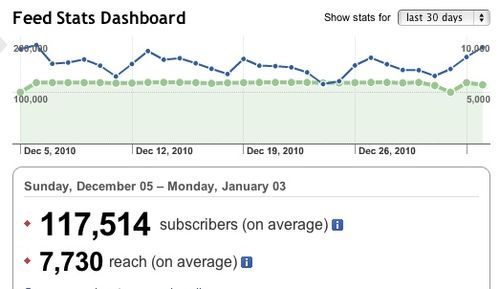
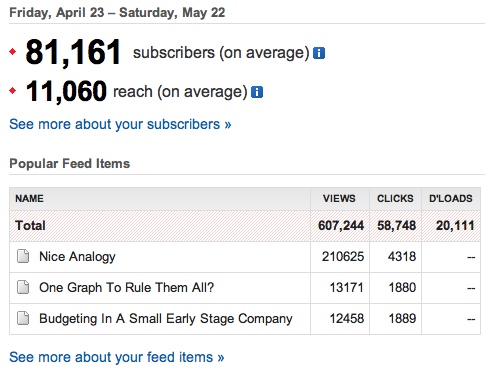
But as some of the commenters on that TechCrunch post point out, many RSS users consume the content in the reader and don't click thru. That's certainly what goes on with AVC content. Here are AVC's Feedburner stats for the past 30 days:

Feedburner

The blue line is "reach" meaning the number of unique people every day who open an AVC post in their RSS reader. It was almost 10k yesterday and it averaged 7,730 per day over the past month.

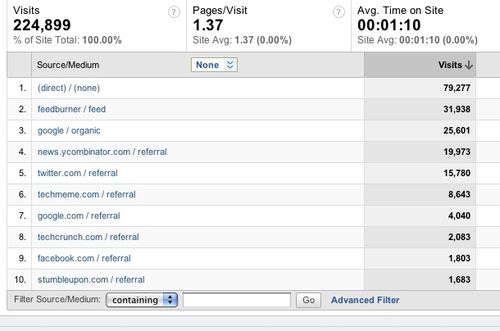
Here is AVC's web traffic over the same period:

Google analytics

So AVC averages about the same number of web visits every day that it gets RSS opens (about 7,500 per day).

Not dead yet.

A few other things worth noting. The direct visits of ~80k per month include a substanital amount of Twitter third party client traffic that doesn't report to Google Analytics as Twitter traffic. That's been a missing piece of the analytics picture for a long time and I wish someone (Twitter and Google??) would fix it.

AVC gets about 2,500 visits a day from RSS. That means about 1/3 of the people who open a post in their reader end up clicking through and visiting the blog. I suspect the desire to engage in the comments drives that.

The twin tech news aggregators, Techmeme and Hacker News, drive a ton of traffic to AVC. Thanks Paul and Gabe!

Bottom line is that RSS is alive and well in the AVC community. While I do agree that Twitter and Facebook have gained significantly in terms of driving traffic across the web, for technology oriented audiences, RSS is still a critically important distribution platform and is very much alive and well.


#Web/Tech#Weblogs

Instrument Your Mobile Apps

In the world of "mobile first, web second" we are seeing a significant uptake in mobile engagement across our entire portfolio. I think this is only the beginning. If you follow the trends out a few years, it could well be that mobile usage of many internet apps will surpass web usage. This is already the case with apps like Foursquare and Instagram. But think about apps like Facebook, Twitter, Tumblr, and Yelp. I can see all of these services having more usage on mobile than web in the not too distant future.

This shift to mobile usage will not be limited to social and local media. I think it will impact every service on the web in some sense. Ecommerce will be affected. Streaming media will be affected. News will be affected. Etc. Etc.

Most everyone uses some form of web analytics these days. Most likely you are using Google Analytics and possibly a lot more on your web app. But are you doing the same thing on your mobile apps? If not you are flying blind. Furthermore, you are missing out on a lot of usage that your employees, investors, and the "market" might want to know about.

We have a portfolio company in this sector, called Flurry, that can help. Flurry's free analytics service is used in tens of thousands of mobile apps across iPhone, Android, Blackberry, and JavaME.

Whether you use Flurry or some other mobile analytics solution, you need to instrument your mobile apps. If you don't you are missing out on a significant amount of usage and it will only grow over time.


#Web/Tech

Going Direct

Every few months, I like to share some analytics on this blog's audience. Here's the google analytics refer logs for the past thirty days:

Analytics

The thing that jumps out at me is the magnitude of the direct audience. If you add the direct category, this blog's RSS feed (Feedburner), and the avc.blogs.com domain (the original domain of this blog which still works), you get roughly 86,000 visits which is roughly half of all the visits.

That's a lot of direct visits for a website given all the distribution channels out there (Google, Twitter, Facebook, Techmeme, Hacker News, etc).

I think it reflects two things:

1) the loyalty of this blog's audience – many of you come to read this blog every day and I suspect that you come via a bookmark, the feed, or some other way you've set up to remember to do that.

2) Twitter – most of the traffic that comes from twitter clients still registers as direct traffic in google analytics. i hope Twitter and Google work out some way to fix that soon. it's been an issue for years now.

SInce I don't use a feed reader of any kind, I often forget how powerful that distribution channel is. I was one of the first users of Feedburner and was an investor in Feedburner before it was sold to Google. I don't think about Feedburner much any more. It's a set it and forget it sort of thing. But Feedburner is a huge distribution channel for this blog. Here are some stats for the past thirty days:

Feedburner
The reach number is the number of different feed readers that open a post from this blog per day. Feedburner tells us that an average of 11k readers per day open a post from this blog in their reader. Google Analytics says the number of web visits per day to this blog is between 5k and 10k on most days. So that means that there are more readers of this blog via the feed than the web.

It's pretty eye opening to be honest. I spend so much time thinking about internet distribution channels and the impact of search and social media on audience and traffic that I don't pay as much attention to the value of a loyal and consistent audience and yet that is exactly what we have here at AVC. Kind of ironic. 

Enhanced by Zemanta

#Web/Tech#Weblogs

Twitter.com vs The Twitter Ecosystem

John Borthwick, co-founder of Betaworks, parent company to bit.ly, twitterfeed, tweetdeck, chartbeat, and many other interesting web services, posted yesterday on "Ongoing tracking of the real time web …

Through these various Betaworks companies, John and the team have access to a tremendous amount of data and if you are interested in this subject, you really should read John's post.

I develop many of my theses based on what I see happening on this blog. And I've been seeing something on this blog that has gotten my attention.

Traffic is way up to this blog in the first half of January. This blog has seen as many visits in the first half of January as a normal month.

Sitemeter stats

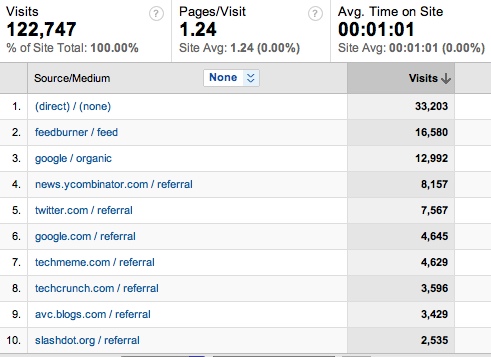
So I went to Google Analytics to find out why. And I didn't see anything particularly new and different in the first half of this month.

Goog analytics
 

But that direct number bugs me so I sent John an email to see what I could learn. The first thing I learned is that he was planning a post (link above) on this exact topic. And he sent me some data on the clicks to avc.com from bit.ly in the first half of January. Here's a snapshot from John's email to me:

Email from john
 

Now, where would google analytics be capturing those 35,147 clicks? Well Twitter.com for sure. But that's only 7,567. Could the other ~28,000 clicks be in the "direct" number? I am absolutely positive that a bunch of them are.

But think about this for a second. Of the 35,000 clicks I got from bit.ly in the first half of January, only 20% of them came from Twitter.com. So exactly how big is Twitter.com vs the Twitter ecoystem?

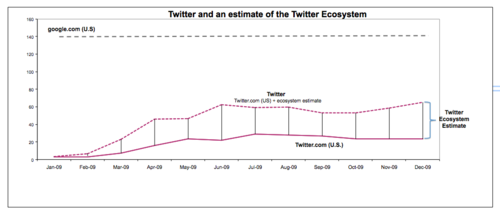
Well, let's go back to John's post and pull my favorite chart out of it:

Twitt+eco
 

John's chart estimates that Twitter.com is about 20mm uvs a month in the US (comScore has it at 60mm uvs worldwide) and the Twitter ecosystem at about 60mm uvs in the US.

That says that across all web services, not just AVC, the Twitter ecosystem is about 3x Twitter.com. And on this blog, whose audience is certainly power users, that ratio is 5x.

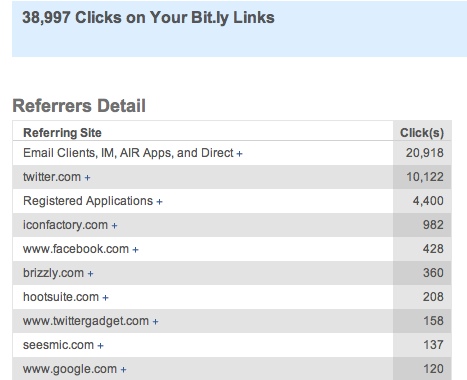
Just to double check, because this is a seriously big deal, I checked all the links I bit.ly "ized" this past 30 days. Here's where they were clicked on:

Bit

So the links I put out into Twitter in the past 30 days generated almost 39,000 clicks. Nice. But only 10,000 of those clicks happened on Twitter.com. The rest happened elsewhere in the Twitter ecosystem, including Facebook which is part of the Twitter ecosystem when they showcase a post that is generated on Twitter, as all of mine are.

So that's a 4x ratio. That's a good double check. Whether its 3x (John's post), 4x (my links), or 5x (incoming traffic to AVC), it is clear that there's a big difference between the two.

My point is this. You can talk about Twitter.com and then you can talk about the Twitter ecosystem. One is a web site. The other is a fundamental part of the Internet infrastructure. And the latter is 3-5x bigger than the former and that delta is likely to grow even larger. 

Reblog this post [with Zemanta]

#VC & Technology